Portfolio

Obtain and clean data - Gasoline price in Mexico 2023

In this project, I created a script for Google Sheets that extracts two XML files directly from the Mexican government’s open data page. The macro extracts both files into a spreadsheet, and with another macro, reverse geolocation is used to write the state of the coordinates of the document. Then, the project is created in Tableau, which is an interactive map where you can filter gas stations by state and gasoline price. View source | View script on GitHub | View in Tableau | View Spreadsheet.

Storytelling - Restaurant

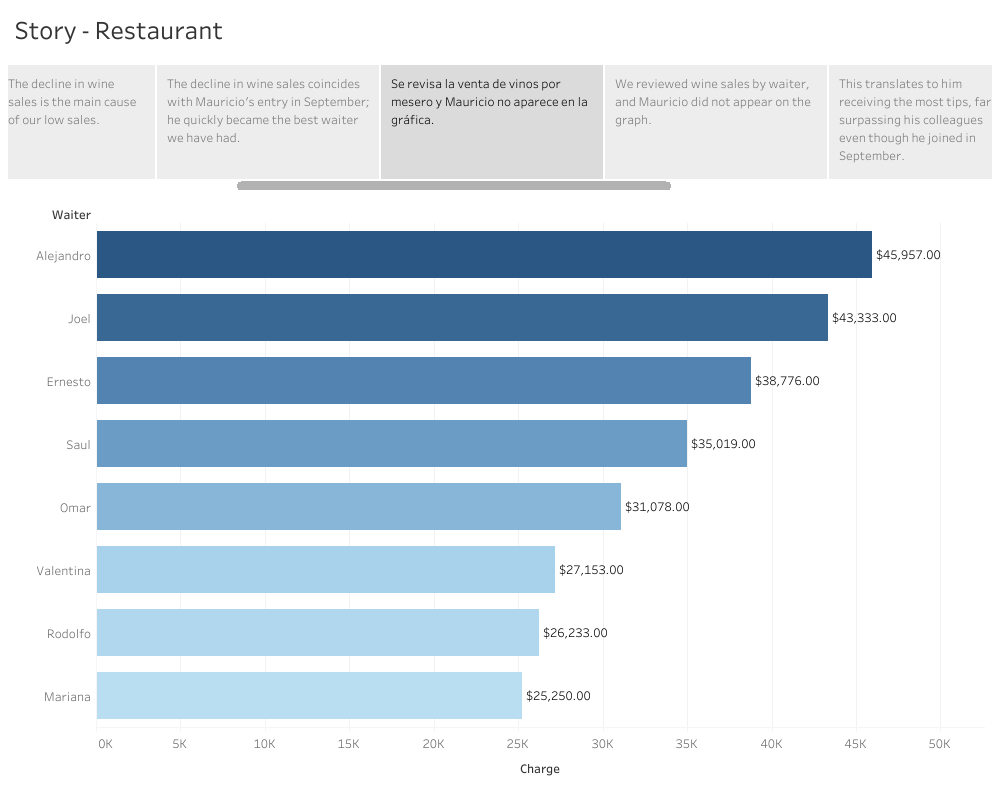
In this project, I tackled a practical case of a local restaurant to understand why their sales had suddenly decreased in a short period of time. Using data analysis techniques, I worked to identify the underlying causes of the problem.

This project demonstrates my ability to work with complex data and find meaningful patterns that can affect business performance. It also highlights my ability to communicate key findings. View story.

Dashboard - HR Analytics

This is an interactive dashboard that analyzes the Attrition rate of a
company. There are multiple ways to filter the information, including
selecting visuals to drill down into the required information. View in
Tableau
.